Logs & Metrics
See what your app is doing.
Belune streams container logs live and keeps recent history, with a severity level on every line. Alongside them, per-application metrics show CPU, memory, and network I/O in real time — so you can see load and spot problems without extra tooling.
Application Logs
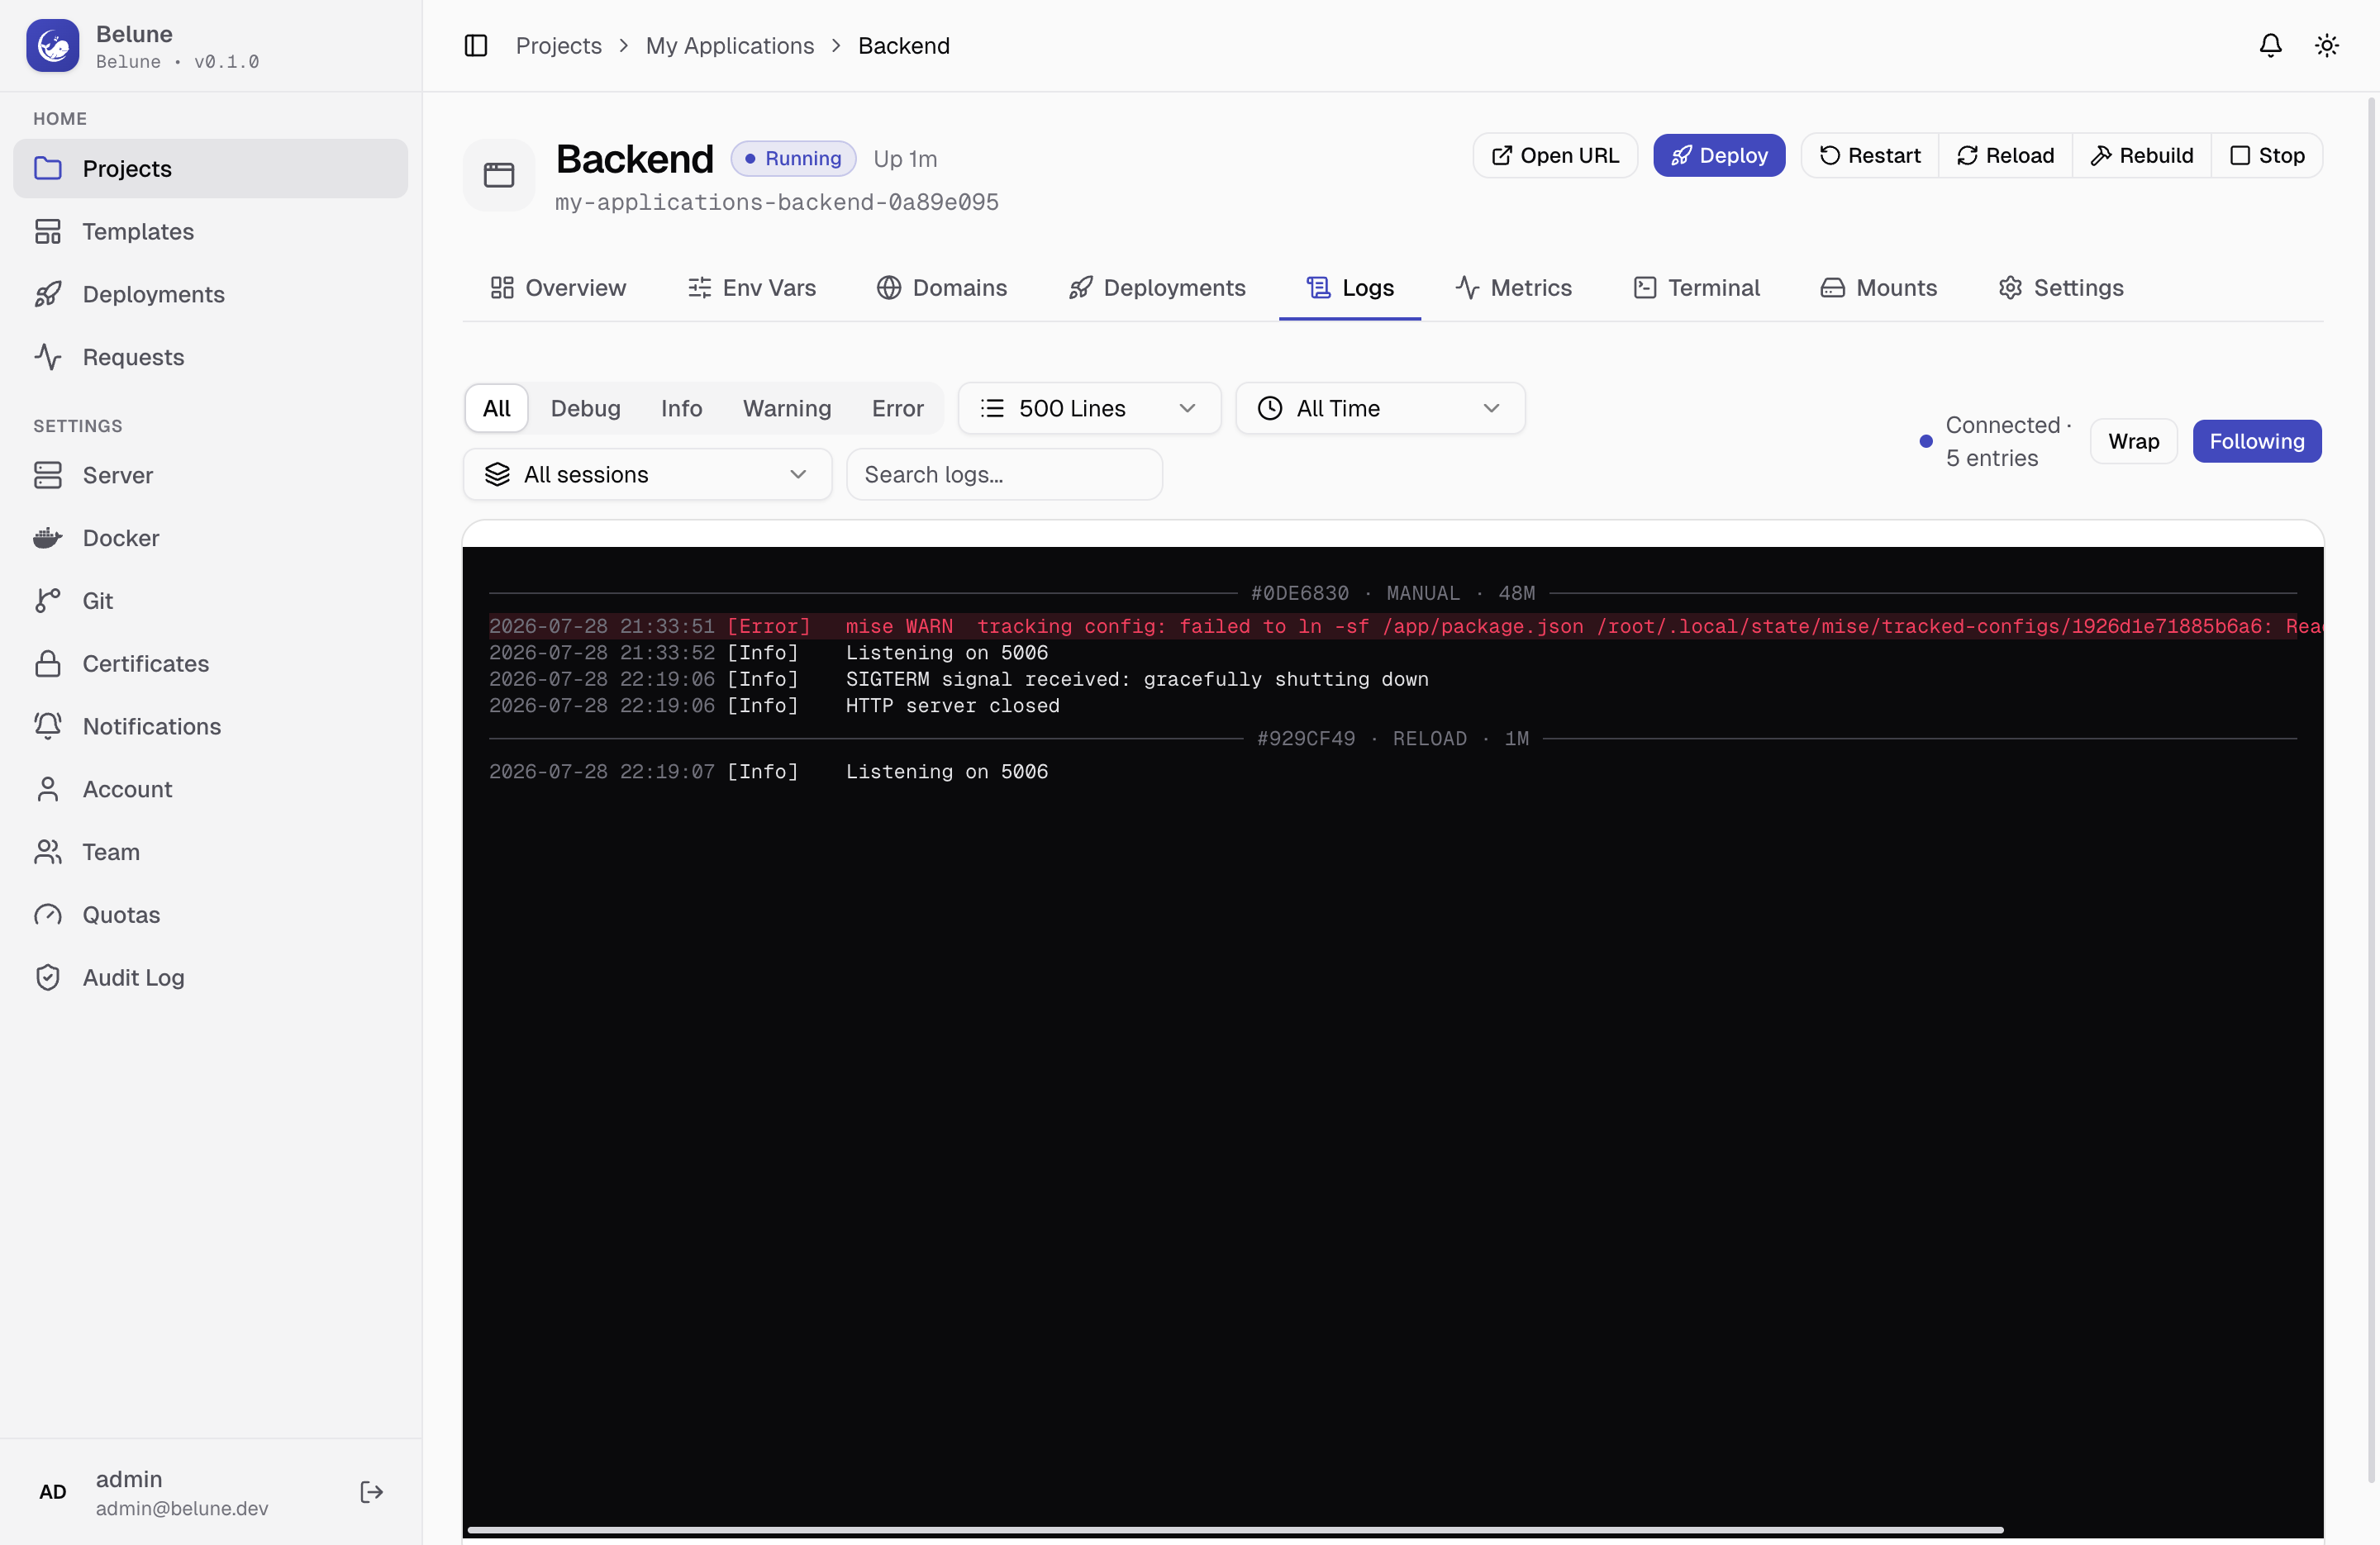
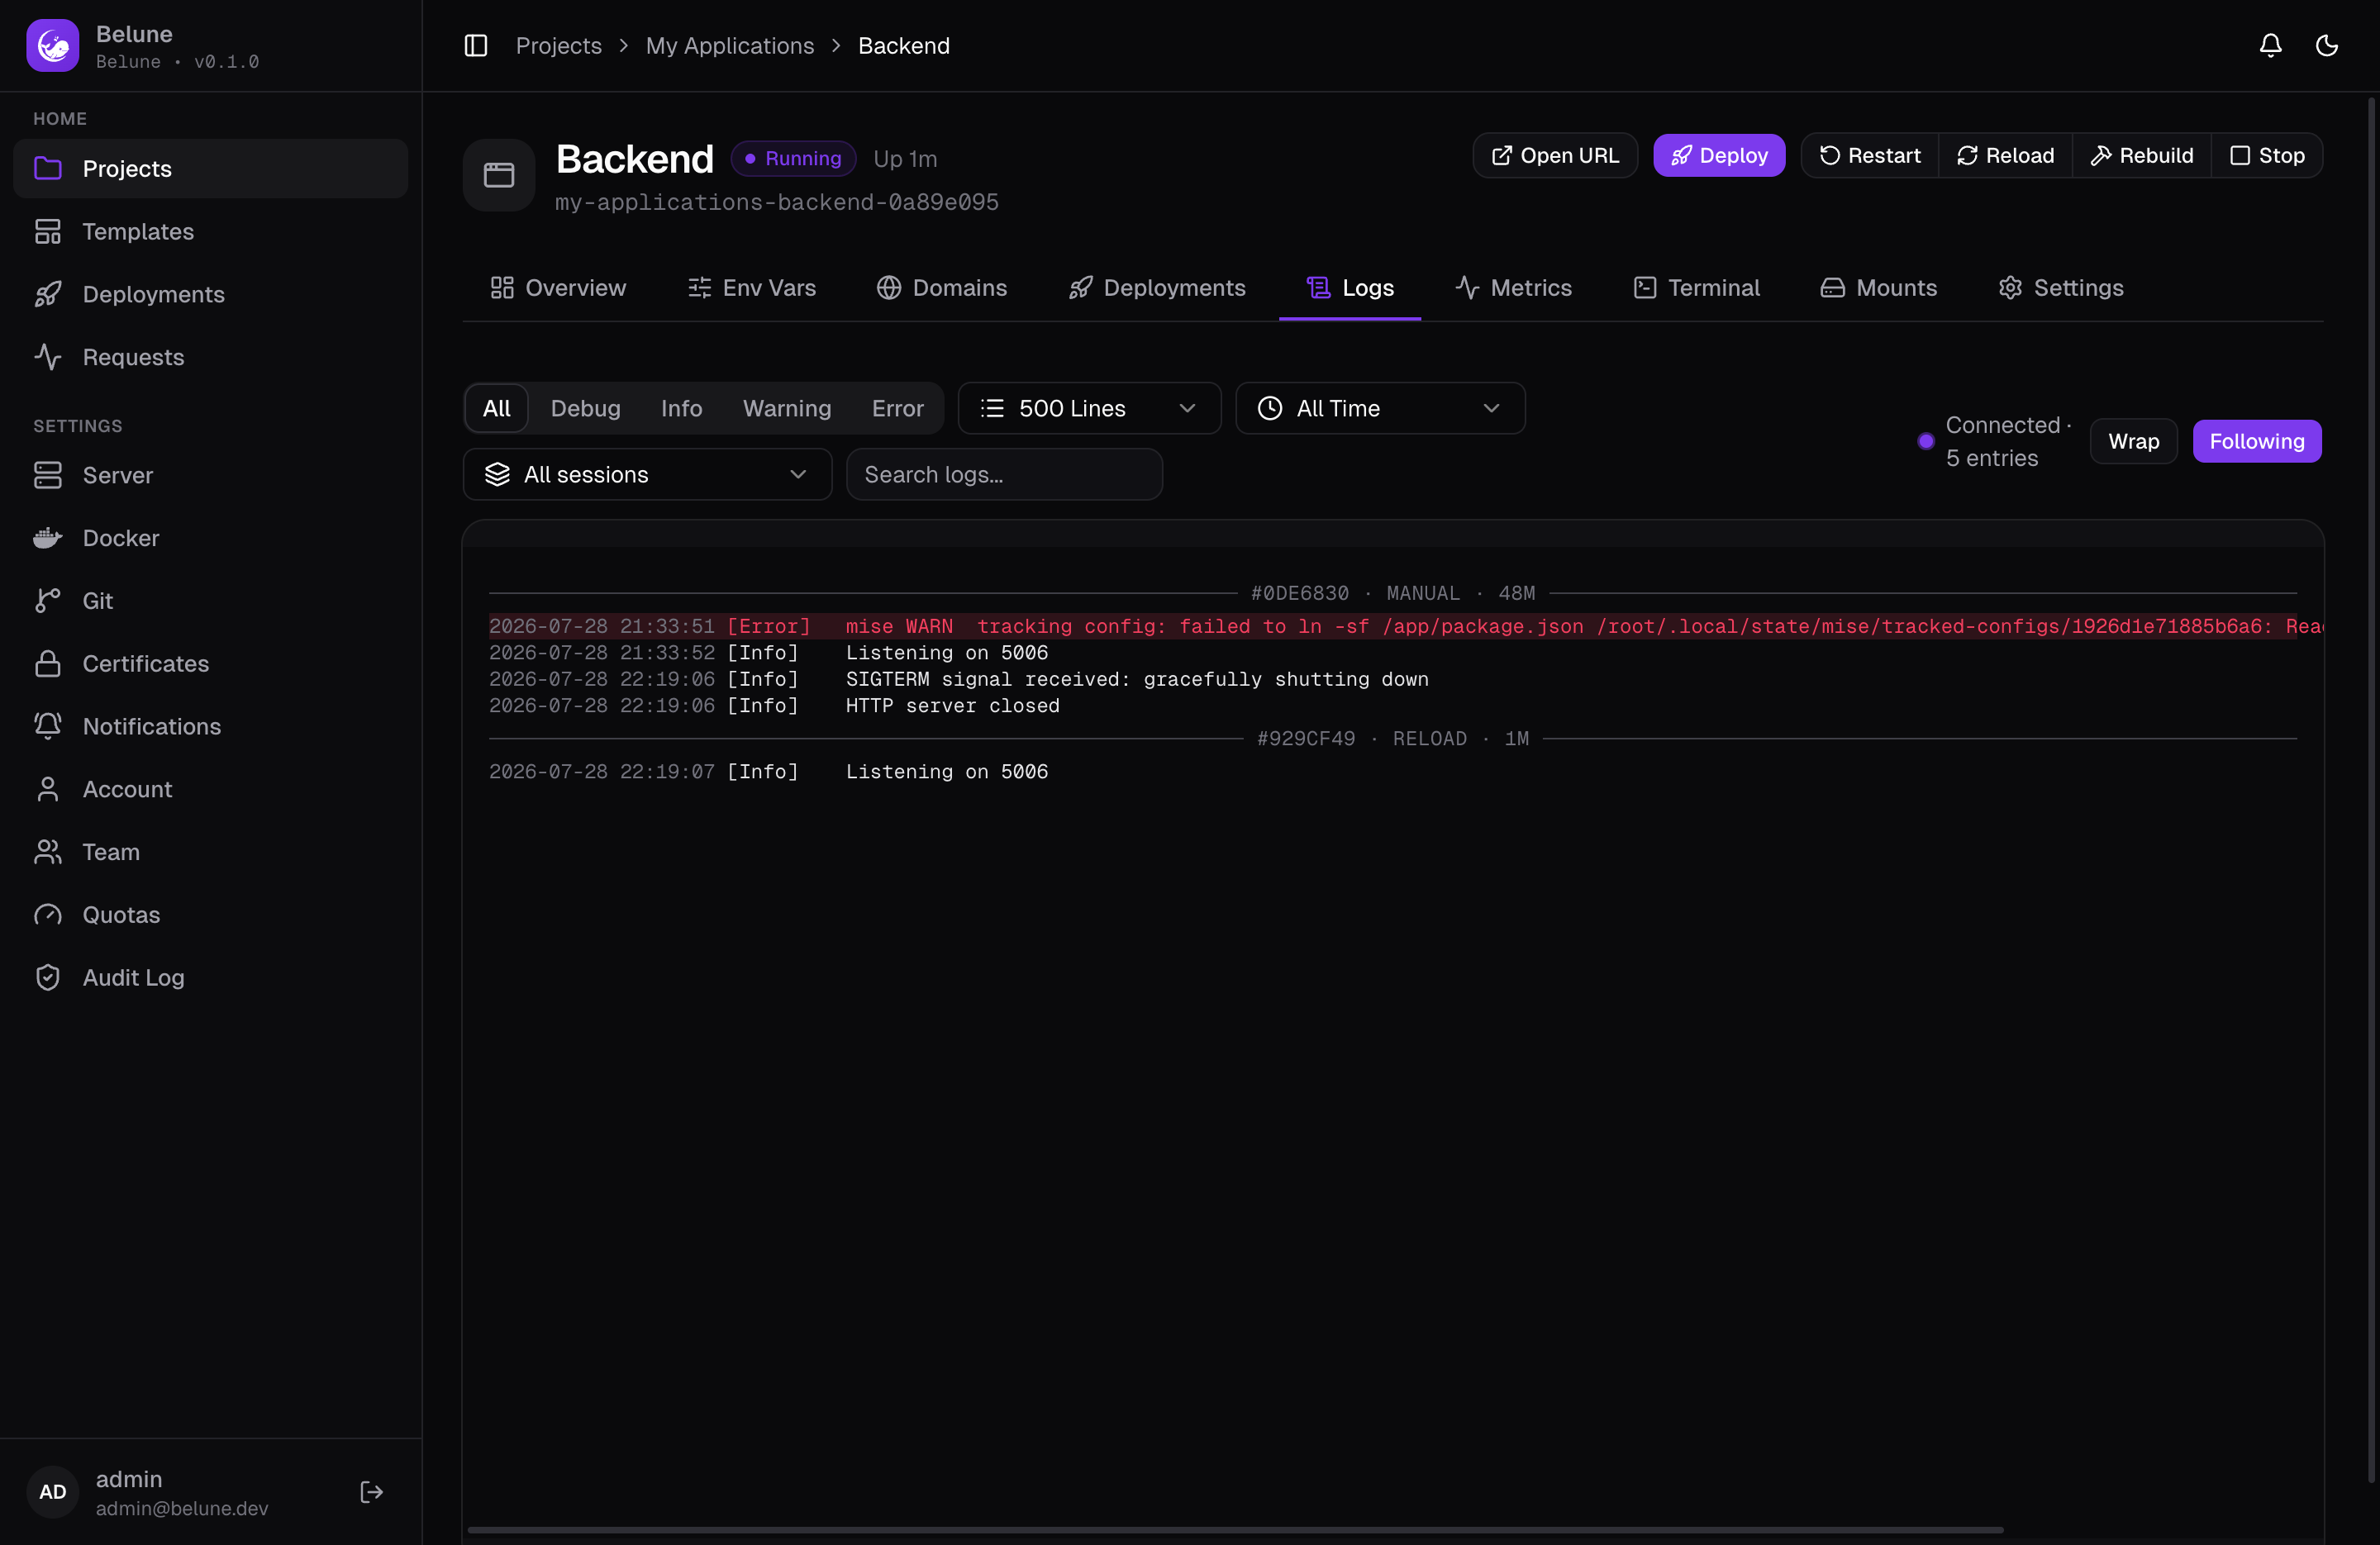
The Logs tab combines a live stream with recent history in one scrollback, filterable by level and keyword, with ANSI color codes stripped so raw terminal escape sequences don't leak into the view.
Build and Deployment Logs
A build's output lives on the Deployments tab instead — each deployment keeps its own log, streamed live while building and browsable afterward. See Deployments.
Metrics
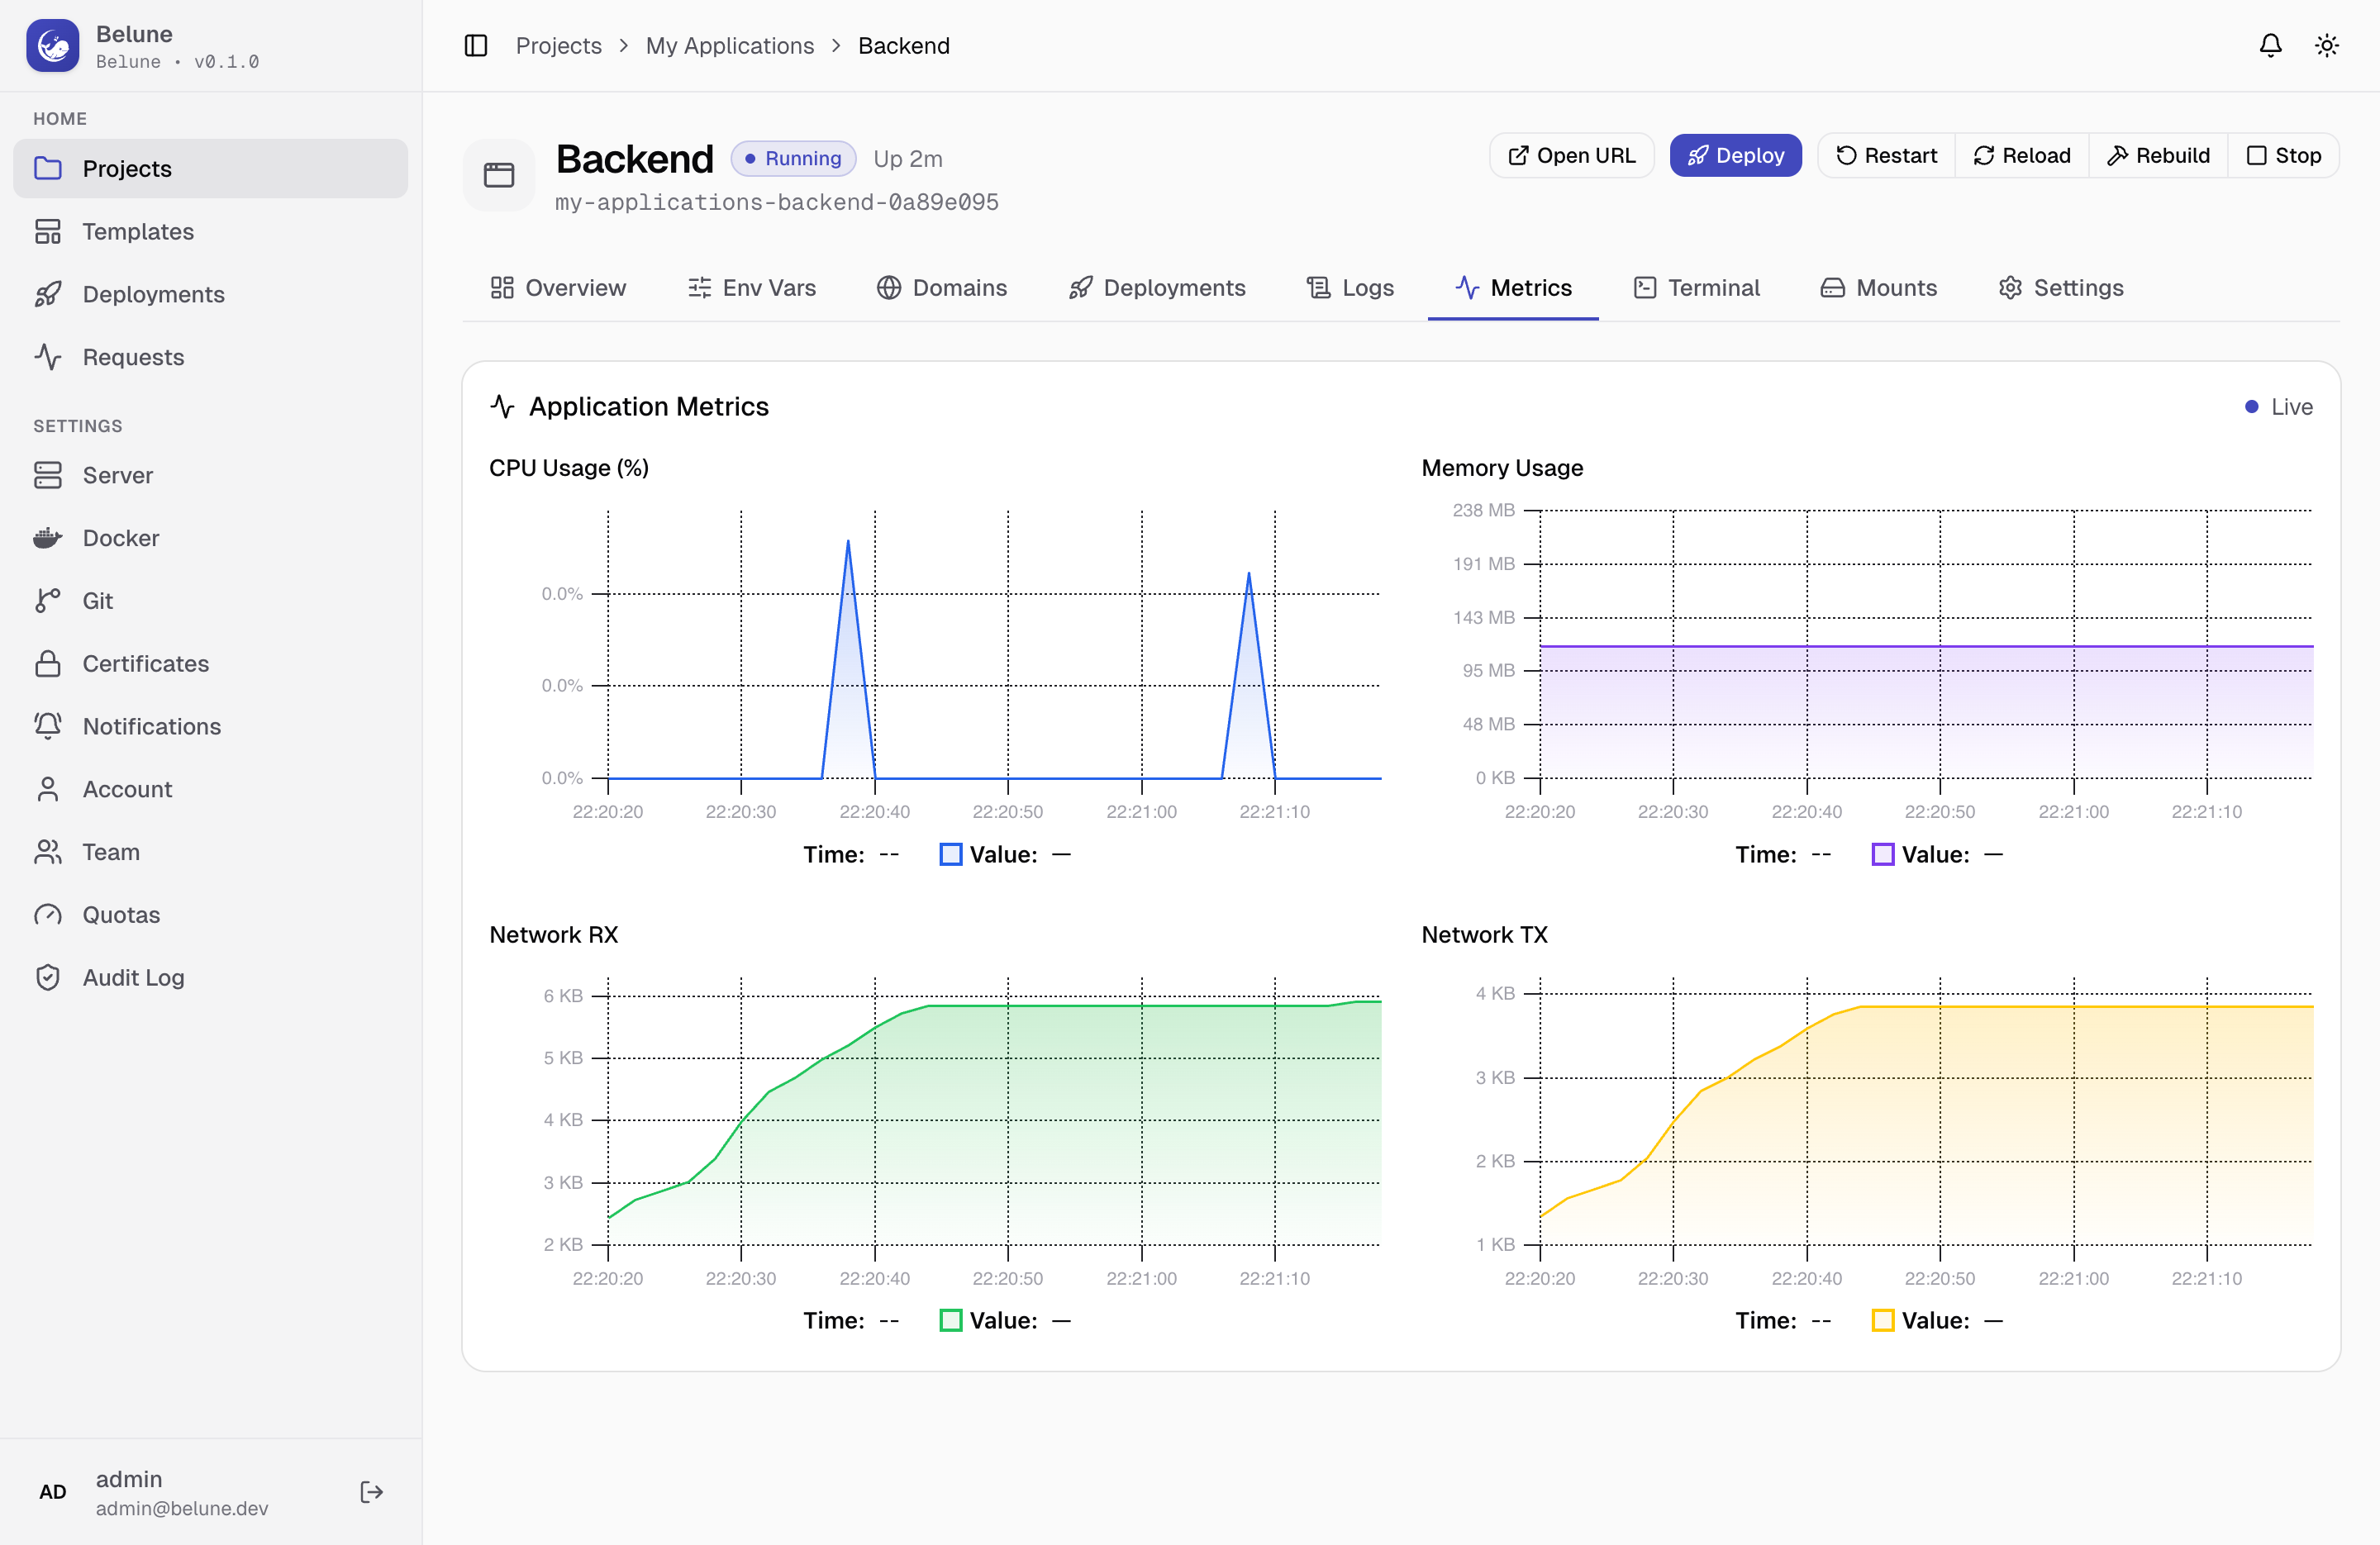
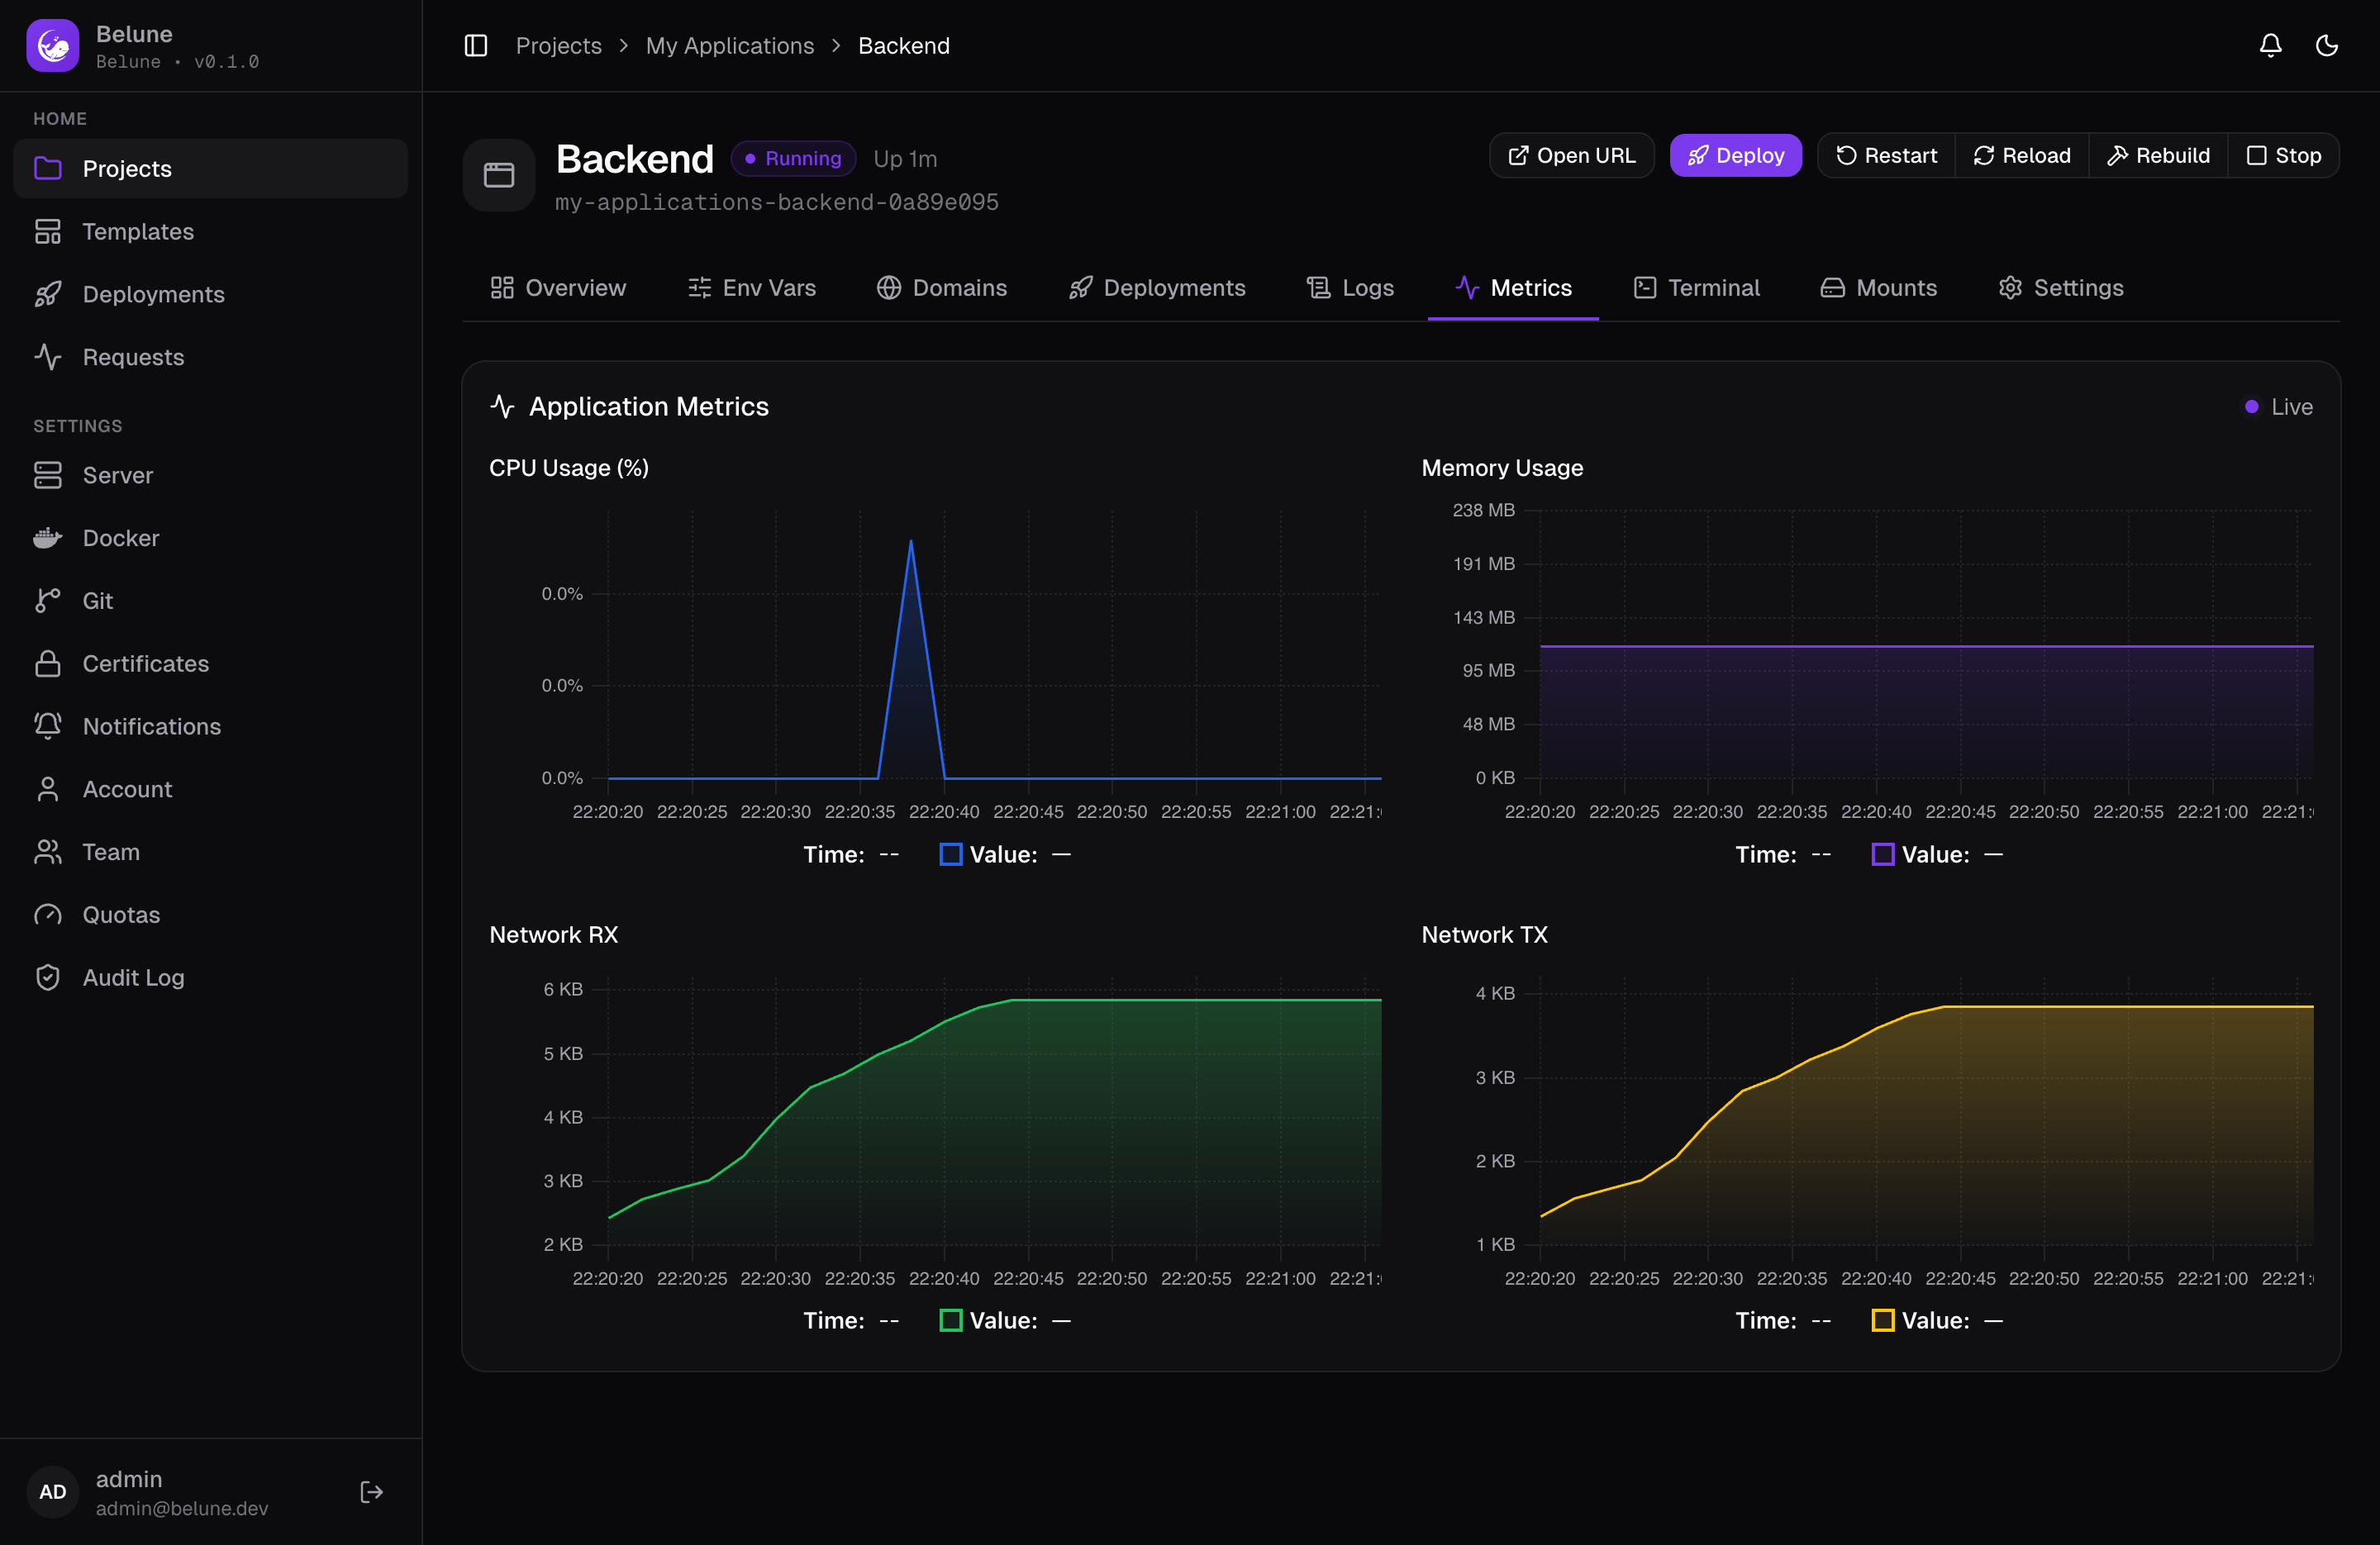
The Metrics tab charts CPU usage, memory usage, and network RX/TX, streaming every ~2 seconds while the application is running.
Metrics describe a running process, so nothing collects while it's stopped, and the tab says so plainly rather than leaving a stale chart on screen.
Exporters
Belune exposes Prometheus-format metrics at /metrics and can export traces over OTLP, for hooking into monitoring you already run. Both are environment-variable configured, with no dashboard UI:
For metrics, set METRICS_BIND (e.g. 127.0.0.1:9090) to serve /metrics on its own unauthenticated listener — leave it unset and /metrics is still reachable, just behind admin auth on the main API.
For traces, set OTEL_EXPORTER_OTLP_ENDPOINT to your collector's host:port (not a full URL) and OTEL_EXPORTER_OTLP_INSECURE if it isn't behind TLS (defaults to true, suited to a loopback collector).